Commentary, information and resources related to green manufacturing, sustainable manufacturing and sustainability in the US and abroad. Based on information from a variety of sources (web to print) and including technical information from researchers in the field as well as researchers at the University of California in the Laboratory for Manufacturing and Sustainability (LMAS - lmas.berkeley.edu).
We are saddened to report that Professor Dornfeld passed away in March, 2016. If you enjoyed his blog, please consider making a contribution to The David A. Dornfeld Graduate Fellowship fund at UC-Berkeley that has been established in his memory to support high-achieving graduate students in the Department of Mechanical Engineering.
Monday, December 26, 2011
Tools of the trade, Part 4
Building the green manufacturing pipeline
It has been a busy month of December so I am a bit behind in this posting. The good news is some of my activities helped me to frame this and the next few discussions!
In a post on October 14, 2009 I discussed the concept of "ubiquitously green" as we were getting into the green manufacturing subject in greater detail. I cited Miriam Webster (aka "the dictionary") for a definition of ubiquitous as "existing or being everywhere at the same time; constantly encountered; widespread" and they give the example "a ubiquitous fashion." The adverb ubiquitously means, essentially, in a ubiquitous manner. Another term that could be used here is holistic - meaning incorporating all aspects.
The topic then was expanded to a discussion of the terms "design for manufacturing" (or DfM) and "manufacturing for design" (MfD). These terms are commonly used in the semiconductor industry where manufacturing restrictions often limit the capability of designers in chip design. The concept is that, from the perspective of the designer, she should be able to look down the product development and manufacturing pipeline and anticipate problems and challenges to manufacture the design or some particular feature. It's the reverse for the MfD side. The manufacturing engineer should be able to look up the pipeline and see design features and elements that are going to cause challenges. Or, ideally, see the requirements of design in advance so that the capable manufacturing processes or systems can be in place when the design rattles down the pipe to production.
This view works well with a temporal representation of the design to manufacturing to distribution to use and end of life treatment scenario. And, hence, the requirement is that throughout all the stages from extraction of materials through the process of their conversion, to manufacture and assembly of the product, its distribution and delivery, use and eventual reuse, remanufacture or recycling, the principles of green and sustainable manufacturing should be "everywhere at the same time; constantly encountered."
I like this view. It creates a clear mental image of the various actors, almost in relay race style, handing off their piece of the process to the next person in the pipeline with the coordination and competence typical of a relay team competing in a race.
Tools to help with the design to production pipeline. I've used the image shown below to delineate the critical elements in the pipeline from a production process development and implementation view (remember I am a manufacturing engineer and the blog is titled "green manufacturing"!).
This view starts with a functional model of a process for creating the features of the part or workpiece and then continues through the prototype building (or at least solid conceptualization from the process model output) through integration with the computer aided design (or CAD) capability to insure that process scale-up can be achieved and then the details of production line layout (design and optimization), supply chains with the requisite quality gates and, finally, but not necessarily lastly, the integration of the environmental impacts, social effects, energy, material utilization, etc. for green manufacturing.
What makes this so "connected" so that the person on the process model end of the pipe (and with the specification of the part from the design team in hand) can see down the entire length of the pipeline and envision the opportunities and problems to be taken or avoided (respectively) while doing his or her part?
Simple answer - data. Data on the design; data on the materials available and their usage; data on the impacts of the process steps; data on efficiency of the factory layout; data on the distribution network and supply chain; data on the consumer usage and re-use potential; data on the recovery of materials from the product at end of life; and so on and so on.
The tools we are referring to should allow this "temporal" representation, or time dependent sequence of stages, to be compressed into the frame of view of whomever is working along the pipeline. That is, we should need no longer wait for action and reaction, then assessment and correction and repeat the process.
That's the kind of tools I am referring to. Pipeline at the speed of light - or data transfer and representation in real time.
Then we need to step back from manufacturing. What comes before? Should this be linked in to the pipeline? Meaning, should we "add some pipe" to the front of the manufacturing image illustrated above?
You bet we should!
Here is a representation of the "design to manufacturing" steps I've used before. It starts a long time before a designer starts inputting data to the CAD system. In an idealized process, we speak to the
customers to understand what they want, need. We write design specifications. We do a conceptual and then detailed design. We then hand this off to manufacturing. Actually, today, there is a lot more feedback between all these steps and, again, not as sequential as we might think.
But, the important idea is that this product creation "pipeline" is on the front of the manufacturing pipeline shown earlier.
Same story. Same need for data instantaneously available at all stages of the pipe. Same ability to see what the effect of one's impact is "downstream" in the pipeline. But, it is not a real impact if we do this right - only a potential impact. An impact we can amplify or attenuate depending on what we are trying to achieve.
Next time we'll look at some of the tools already available to enable big chunks of this pipeline and the kind and sources of data to drive this.
It has been a busy month of December so I am a bit behind in this posting. The good news is some of my activities helped me to frame this and the next few discussions!
In a post on October 14, 2009 I discussed the concept of "ubiquitously green" as we were getting into the green manufacturing subject in greater detail. I cited Miriam Webster (aka "the dictionary") for a definition of ubiquitous as "existing or being everywhere at the same time; constantly encountered; widespread" and they give the example "a ubiquitous fashion." The adverb ubiquitously means, essentially, in a ubiquitous manner. Another term that could be used here is holistic - meaning incorporating all aspects.
The topic then was expanded to a discussion of the terms "design for manufacturing" (or DfM) and "manufacturing for design" (MfD). These terms are commonly used in the semiconductor industry where manufacturing restrictions often limit the capability of designers in chip design. The concept is that, from the perspective of the designer, she should be able to look down the product development and manufacturing pipeline and anticipate problems and challenges to manufacture the design or some particular feature. It's the reverse for the MfD side. The manufacturing engineer should be able to look up the pipeline and see design features and elements that are going to cause challenges. Or, ideally, see the requirements of design in advance so that the capable manufacturing processes or systems can be in place when the design rattles down the pipe to production.
This view works well with a temporal representation of the design to manufacturing to distribution to use and end of life treatment scenario. And, hence, the requirement is that throughout all the stages from extraction of materials through the process of their conversion, to manufacture and assembly of the product, its distribution and delivery, use and eventual reuse, remanufacture or recycling, the principles of green and sustainable manufacturing should be "everywhere at the same time; constantly encountered."
I like this view. It creates a clear mental image of the various actors, almost in relay race style, handing off their piece of the process to the next person in the pipeline with the coordination and competence typical of a relay team competing in a race.
Tools to help with the design to production pipeline. I've used the image shown below to delineate the critical elements in the pipeline from a production process development and implementation view (remember I am a manufacturing engineer and the blog is titled "green manufacturing"!).
This view starts with a functional model of a process for creating the features of the part or workpiece and then continues through the prototype building (or at least solid conceptualization from the process model output) through integration with the computer aided design (or CAD) capability to insure that process scale-up can be achieved and then the details of production line layout (design and optimization), supply chains with the requisite quality gates and, finally, but not necessarily lastly, the integration of the environmental impacts, social effects, energy, material utilization, etc. for green manufacturing.
What makes this so "connected" so that the person on the process model end of the pipe (and with the specification of the part from the design team in hand) can see down the entire length of the pipeline and envision the opportunities and problems to be taken or avoided (respectively) while doing his or her part?
Simple answer - data. Data on the design; data on the materials available and their usage; data on the impacts of the process steps; data on efficiency of the factory layout; data on the distribution network and supply chain; data on the consumer usage and re-use potential; data on the recovery of materials from the product at end of life; and so on and so on.
The tools we are referring to should allow this "temporal" representation, or time dependent sequence of stages, to be compressed into the frame of view of whomever is working along the pipeline. That is, we should need no longer wait for action and reaction, then assessment and correction and repeat the process.
That's the kind of tools I am referring to. Pipeline at the speed of light - or data transfer and representation in real time.
Then we need to step back from manufacturing. What comes before? Should this be linked in to the pipeline? Meaning, should we "add some pipe" to the front of the manufacturing image illustrated above?
You bet we should!
Here is a representation of the "design to manufacturing" steps I've used before. It starts a long time before a designer starts inputting data to the CAD system. In an idealized process, we speak to the
customers to understand what they want, need. We write design specifications. We do a conceptual and then detailed design. We then hand this off to manufacturing. Actually, today, there is a lot more feedback between all these steps and, again, not as sequential as we might think.
But, the important idea is that this product creation "pipeline" is on the front of the manufacturing pipeline shown earlier.
Same story. Same need for data instantaneously available at all stages of the pipe. Same ability to see what the effect of one's impact is "downstream" in the pipeline. But, it is not a real impact if we do this right - only a potential impact. An impact we can amplify or attenuate depending on what we are trying to achieve.
Next time we'll look at some of the tools already available to enable big chunks of this pipeline and the kind and sources of data to drive this.
Sunday, November 27, 2011
Tools of the trade, Part 3
Maps and directions
We continue our discussion of the the OECD (Organization for Economic Co-operation and Development) Sustainable Manufacturing Toolkit and related items. In case you've missed the past two posting you can find details on the toolkit in and on line Start-up Guide.
Last time we looked at the seven defined steps from priority setting to performance indicators and normalization factors - factors that relate the level of performance to the individual product (piece, weight, volume) or to sales volume, etc. These factors could be based on production quantities in number, sales volume, hours worked, levels of service provided ("over one billion hamburgers served"!) or product lifetime.
The tool kit also discusses how to prioritize areas of improvement that can be focused on. One can use a degree of impact to assist with prioritization. For example, improving air quality may result in a significant environmental impact as well as business related impacts. "High" impact for the environment is defined as resulting in "significant damage or enhancement to the general environment" and likely to be "of great concern to stakeholders." This level of impact for the business side of the equation is defined a having "significant ramifications for business and reputation with potential for substantial losses or gains."
Medium impact is a lesser - moderate - view of above and low impact is minimal damage or enhancement of environment and ramifications for business and reputation.
One interesting visualization approach suggested is the "priority matrix" for showing, graphically, the positive or negative impacts in terms of key performance indicators. The matrix shows the relative impact in terms of both environmental and business effects/results. On the environmental impact axis contributors include: energy efficiency, air and water quality, use of toxic materials, use of renewable materials, greenhouse gas emissions and product impact. On the business axis contributors include: sales, cost, licence to operate, disruptions to operation and reputation/brand.
The illustration below, from OECD, shows the bands of high priority issues (dark) to low priority issues (light) in this matrix with a data point for each impact or, I assume, interaction between business and environment.
The impacts with the highest potential for improvement/damage are the first priority.
This type of visualization has been proposed by others as well and can be a powerful illustrative tool for showing present circumstances (in terms of environmental or business conditions) as well as plotting changes.
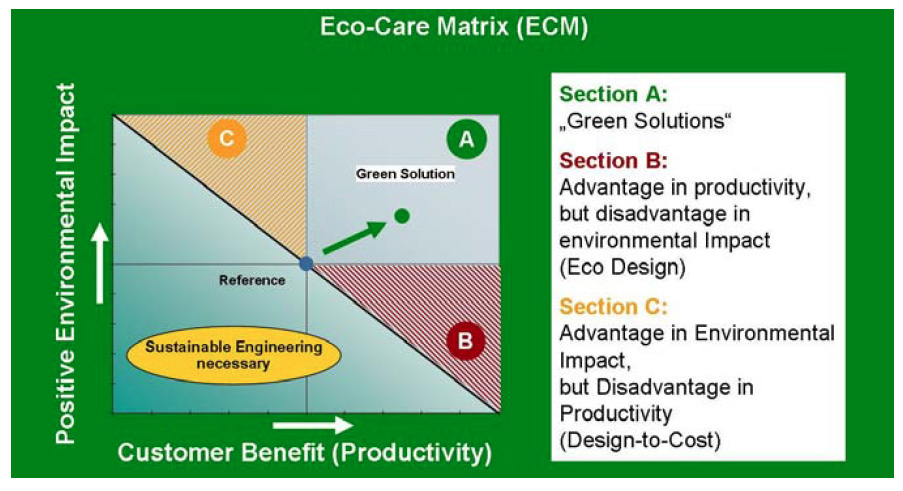
An excellent example of this is the Siemens "Eco-care Matrix". The eco-care matrix has along the x-axis the business or customer benefit and along the y-axis the environmental benefit. A presentation by the head of Siemens Industry Solutions Division last year explained that the concept is to allow the assessment of the environmentally compatibility and cost effectiveness of anything from a single product to a complete industrial system or plant. The figure below, from Siemens, illustrates the concept.
The reference dot in the center describes the environmental performance and economical customer benefit of one or more green solutions compared to a defined reference solution (usually an existing product of system.) The environmental performance is measured using typical life cycle analysis (LCA) outputs and, for example, can use the results of a LCA tool such as GaBi. The reference point, according to a published paper by Wegener (see reference below) is based on a system or product that "should deliver nearly the same function or service to the customer as the considered green solution. Only if both product systems under examination have the same function using of course different process technologies and product designs, their environmental impacts can be related to
the same functional unit."
The "new solution" is plotted on the matrix compared to the reference. Only if the trajectory improves both environmental and business benefits is the solution considered an overall improvement.
The economic benefit is determined using standard business accounting practices comparing the costs/benefits of the two alternatives.
For a detailed discussion of this approach, including an example and references, see the paper titled "Improving Energy Efficiency in Industrial Solutions - Walk the Talk" by Dieter Wegener et al from the Riso International Energy Conference in 2011.
A basic example is shown in a web posting from Siemens for a type of gearless AC motors used in dragline excavators — vehicles that pull a bucket freely suspended on a boom across earth or rocks in order to extract materials in large scale mining operations. The high efficiency of these motors makes the excavator 22 percent more environmentally compatible than the DC motor that serves as the reference, while reducing electricity costs by 22 percent.
Reading through the Siemens Eco-care Matrix methodology one can't help but notice strong similarities to the OECD toolkit approach. Concerns are on prioritization, normalization and the use of standardized metrics in the analysis to yield a realistic basis for decision making.
The OECD Toolkit also offers a number of case studies applying the methodology.
A logical process based on measurable impacts/performance related to realistic business outcomes and aided by a methodology for prioritization and progress tracking - all form a solid methodology for greening manufacturing.
Finally, I am participating in an Autodesk sponsored GreenBiz webinar on "Design Technology as a Sustainability Strategy for Manufacturers" on December 13th 2011 at 1PM EST. I will be joined in this webcast by Patrick Coulter, Chief Operating Officer, Granta Design, and Sarah Krasley, Product Manager, Sustainability, Autodesk. Joel Makower, Executive Editor at GreenBiz Group, will moderate the panel. You can find more info, and register for this free event, at the following GreenBiz link. Hope to "see" you there!
Monday, November 14, 2011
Tools of the trade, Part 2
Still turning!
In the last posting we began digging into the OECD (Organization for Economic Co-operation and Development) Sustainable Manufacturing Toolkit. The toolkit can help companies the their business approach to be more viable, socially responsible and get the most out of greening opportunities and features a set of 18 key performance indicators (KPI) to measure and improve the environmental performance of manufacturing facilities.
You can find details on line: a Start-up Guide and a Web Portal with additional technical guidance, data tools and useful links.
The discussion in the toolkit elaborates on the relationships between manufacturing and the environment from the perspective of:
- inputs ( materials and things used in the product you make or in elements that go into the product you make),
- operations (process and systems that take the inputs and convert them into products, including facilities, transport of inputs and products, business travel, employee commuting, and other overhead), and
- products (including their use and end of life disposition)
But, the toolkit indicators mentioned above do not include the impact from commuting staff and logistics to transport inputs or products shown in the figure, but include the impact from business travel. This can be included in other ways.
The tool kit suggests "seven steps" to utilize the KPI's as illustrated in the circle image below from OECD. See the last posting for the list of KPI's.
The process starts with setting priorities and moves through measurement and improvement. Two significant steps are #2, select useful performance indicators (and determining what data needs to be collected), and step #3, measure the inputs used in production (this helps to identify how the materials and components used in production processes and systems influence environmental performance.)
Following this are the improvement steps.
An important part of the analysis is the selection of normalization factors - that is, relating the level of performance to the individual product (piece, weight, volume) or to sales volume, etc. The tool kit illustrates a number of different factors you can select to normalize the performance, including:
- Number, weight or units of products produced in the facility.
- Sales or value added in the facility.
- Person-hours worked in the facility.
- Units of function or level of services to be provided by the products produced in the facility.
- Lifetime of the products produced in the facility.
In our very early discussion of green metrics we introduced normalization factors, for example green house gas emission per capita, or area, or country. These are similar. You want to relate the impact to some measurable unit that makes sense in your business. Then determining where you are, and tracking where you have been or are going, is much easier.
The tool kit also discusses how to prioritize areas of improvement to focus on. It suggests a matrix showing the relative impact in terms of both environmental and business effects/results. This has been proposed by others as well and can be a powerful illustrative tool for plotting changes.
We'll go on to that in the next posting.
Finally, my lab has been looking into social metrics of sustainability and how they intersect engineering and manufacturing decision making and activities. There will be more to come on this for sure. But, in the meantime, one of the researchers found an interesting web-based survey from the Fair Trade Fund, Inc. to estimate your "slavery footprint."
Starting from the question "how many slaves work for you?" (!) it guides you through a set of questions starting with your gender through your living standard, eating habits (including exceptional interest in what kind of nuts you eat), jewels you own, electronics you have, sports you play (and at each stage mentioning the conditions some folks in various parts of the world work in to provide these - for example, did you know that "In China, soccer ball manufacturers will work up to 21 hours in a day, for a month straight" - according to the survey?), and, of course, your closet (and reminding me that "1.4 million children have been forced to work in Uzbek cotton fields. There are fewer children in the entire New York City public school system"!).
At the end it tells you "how many slaves [are] working for [me]" based on their data and on my consumption patterns and, then, the typical supply chains and sources for these goods and materials.
I have no idea how accurate this website is and I do not endorse its data base or determinations. But, it is very illuminating, and sobering if at least true to some extent. It told me I have 48 slaves working for me. (It looks like my closet is the culprit!) Even if it is off by 50% that is still 24 slaves - nothing I am comfortable with.
Try it - it is sobering. And if you are a manufacturer with supply chains or materials sources from some of the suspect regions this can be a cause of concern and risk.
One last thing - LMAS has set up a Twitter page! You can follow the comments and observations of the researchers in LMAS with the "OTHER LINKS ON GREEN MANUFACTURING" on this page on the right. I will add my comments from time to time as well. We promise not to overwhelm you with our "insights"!
In the last posting we began digging into the OECD (Organization for Economic Co-operation and Development) Sustainable Manufacturing Toolkit. The toolkit can help companies the their business approach to be more viable, socially responsible and get the most out of greening opportunities and features a set of 18 key performance indicators (KPI) to measure and improve the environmental performance of manufacturing facilities.
You can find details on line: a Start-up Guide and a Web Portal with additional technical guidance, data tools and useful links.
The discussion in the toolkit elaborates on the relationships between manufacturing and the environment from the perspective of:
- inputs ( materials and things used in the product you make or in elements that go into the product you make),
- operations (process and systems that take the inputs and convert them into products, including facilities, transport of inputs and products, business travel, employee commuting, and other overhead), and
- products (including their use and end of life disposition)
But, the toolkit indicators mentioned above do not include the impact from commuting staff and logistics to transport inputs or products shown in the figure, but include the impact from business travel. This can be included in other ways.
The tool kit suggests "seven steps" to utilize the KPI's as illustrated in the circle image below from OECD. See the last posting for the list of KPI's.
The process starts with setting priorities and moves through measurement and improvement. Two significant steps are #2, select useful performance indicators (and determining what data needs to be collected), and step #3, measure the inputs used in production (this helps to identify how the materials and components used in production processes and systems influence environmental performance.)
Following this are the improvement steps.
An important part of the analysis is the selection of normalization factors - that is, relating the level of performance to the individual product (piece, weight, volume) or to sales volume, etc. The tool kit illustrates a number of different factors you can select to normalize the performance, including:
- Number, weight or units of products produced in the facility.
- Sales or value added in the facility.
- Person-hours worked in the facility.
- Units of function or level of services to be provided by the products produced in the facility.
- Lifetime of the products produced in the facility.
In our very early discussion of green metrics we introduced normalization factors, for example green house gas emission per capita, or area, or country. These are similar. You want to relate the impact to some measurable unit that makes sense in your business. Then determining where you are, and tracking where you have been or are going, is much easier.
The tool kit also discusses how to prioritize areas of improvement to focus on. It suggests a matrix showing the relative impact in terms of both environmental and business effects/results. This has been proposed by others as well and can be a powerful illustrative tool for plotting changes.
We'll go on to that in the next posting.
Finally, my lab has been looking into social metrics of sustainability and how they intersect engineering and manufacturing decision making and activities. There will be more to come on this for sure. But, in the meantime, one of the researchers found an interesting web-based survey from the Fair Trade Fund, Inc. to estimate your "slavery footprint."
Starting from the question "how many slaves work for you?" (!) it guides you through a set of questions starting with your gender through your living standard, eating habits (including exceptional interest in what kind of nuts you eat), jewels you own, electronics you have, sports you play (and at each stage mentioning the conditions some folks in various parts of the world work in to provide these - for example, did you know that "In China, soccer ball manufacturers will work up to 21 hours in a day, for a month straight" - according to the survey?), and, of course, your closet (and reminding me that "1.4 million children have been forced to work in Uzbek cotton fields. There are fewer children in the entire New York City public school system"!).
At the end it tells you "how many slaves [are] working for [me]" based on their data and on my consumption patterns and, then, the typical supply chains and sources for these goods and materials.
I have no idea how accurate this website is and I do not endorse its data base or determinations. But, it is very illuminating, and sobering if at least true to some extent. It told me I have 48 slaves working for me. (It looks like my closet is the culprit!) Even if it is off by 50% that is still 24 slaves - nothing I am comfortable with.
Try it - it is sobering. And if you are a manufacturer with supply chains or materials sources from some of the suspect regions this can be a cause of concern and risk.
One last thing - LMAS has set up a Twitter page! You can follow the comments and observations of the researchers in LMAS with the "OTHER LINKS ON GREEN MANUFACTURING" on this page on the right. I will add my comments from time to time as well. We promise not to overwhelm you with our "insights"!
Sunday, October 30, 2011
Tools of the trade, Part 1
Turning the supertanker
As any good engineer knows (and carpenter, surgeon, chef, etc. I imagine) you are only as effective at your task as the tools you have. And your own skill of course.
Over the past two years we have discussed various approaches to greening manufacturing, the metrics you need to use, the tools that can help act on the results of the metric data and some examples.
I attended the first annual CaFFEETForum last week in San Francisco. CaFFEET is an acronym for California France Forum on Energy Efficiency Technologies and the focus of the meeting was achieving low-CO2 industrial plants. Sponsors included the French electricity utility, EDF and our local utility, PG&E along with several organizations including EPRI (Electric Power Research Institute). The discussion centered in energy (meaning not much attention to the other green elements like water, materials and other resource use.)
One of the speakers from EDF reviewed two major barriers to reducing greenhouse gas emissions in industry:
- the approaches considered to achieve decreases too often focus only on energy efficiency without considering the attractiveness of the business model for the approach (that is, great idea but economically infeasible), and
- industry in general and facilities in specific don't always have the in-house expertise/competence to manage projects of this size/scope
He was speaking generally of large scale projects such as replacing boilers or heat recovery systems and not just turning off lights in warehouses.
The speaker elaborated a strategy to overcome those barriers and assist industry at the plant level to decrease emissions based on three principles:
One - Levers: take advantage/utilize one or more of these 7 levers to reduce greenhouse gas emissions:
1) energy efficiency,
2) on-site renewable energy,
3) fuel switching,
4) energy storage,
5) demand response,
6) carbon offsets, and
7) green electricity purchase.
Most of these are well known in name or have been discussed in earlier blog postings here. Demand response is a bit more complicated (and there was a long discussion about "smart grid" at the meeting and what that means for industry) and we'll spend some time in a future posting going over smart grid and demand response technology and likely impacts in manufacturing.
I think there could be another lever - recovering energy from the process - but, when questioned, the speaker thought that was part of the first lever.
These seven levers, applied individually or combined would allow engineers/manager to identify and assess several possible technical approaches and, more importantly, associated business models. A fascinating part of the discussion was what are acceptable returns on investment to "make the business model work."
Two - Think big - a holistic analysis of the plant identifying the combination of levers that maximizes the emission reduction per invested dollar is required. This will insure that a profitable business models for the stakeholders is in place. This holistic analysis should consider the entire set of factors involved, for example, the types of industrial processes, local weather conditions, the carbon content of the electricity from your supplier/grid (recall the conversion of kWh to GHG and its dependency on the source of the electricity - nuclear to coal to hydro), and any expected evolutions of the plant and the various costs (get out your crystal ball!), and
Three - Get expertise - it may be advantageous to set up a partnership with an organization that has experience employing the seven levers in your industry to ensure that the analysis and eventual recommendations are objective.
Did I mention that there were a number of consulting organizations involved with the forum? This last one is for them!
But, sarcasm aside, this is a very logical approach.
To insure that any of the efforts from applying these levers, or any other levers you might use, are effective, it is helpful to have tools to measure the present state of your environmental performance (energy use, greenhouse gas, materials, wastes, water, etc.).
That's where the OECD (Organization for Economic Co-operation and Development) Sustainable Manufacturing Toolkit comes in. As reported in the last blog, the toolkit can help companies with their business approach to insure it can be more viable, socially responsible and get the most out of greening opportunities. One feature is that outlines a set of 18 key performance indicators (KPI) to measure and improve the environmental performance of manufacturing facilities.
In case you missed reading the last posting, you can find a Start-up Guide providing a step-by-step approach to measuring and benchmarking environmental performance, and a Web Portal with additional technical guidance, data tools and useful links.
So, what does the toolkit do?
First of all, it defines sustainable manufacturing as, basically, as progression of green steps. I understand that sustainability is the destination and not the journey. I have consistently defined green manufacturing as the steps along the path towards sustainability, see the posting on technology wedges. Green manufacturing technology wedges help to "turn the supertanker!"
Others are more severe in their definitions!
Graedel and Howard-Grenville explained the nature of sustainability in their book "Greening the Industrial Facility" (Springer, 2005, p.126). They bluntly stated:
"A crucial important property of sustainability is that the concept is an absolute, as are pregnant and unique, to use two common examples. A sustainable world is not one that is slightly more environmentally responsible than it was yesterday.”
I tend to prefer this absolute definition and have used that in earlier blogs. Others take a more nuanced view but, I expect, do understand the full impact of sustainable manufacturing is achieved over some time with many small steps.
So, what about the OECD. They cite the US Department of Commerce's definition (“The creation of manufactured products that use processes that minimize negative environmental impacts, conserve energy and natural resources, are safe for employees, communities, and consumers and are economically sound” from US Department of Commerce (2011), Sustainable Manufacturing Initiative website.
They elaborate that sustainable manufacturing is "all about minimising the diverse business risks inherent in any manufacturing operation while maximising the new opportunities that arise from improving your processes and products."
The guide helps engineers and business folks improve the environmental performance of their facilities, systems and processes.
The guide also gives helpful background on motivations for sustainable/green manufacturing - very similar to those used when I started this blog and we asked "why green manufacturing."
Importantly, the OECD guide introduces a set of sustainable manufacturing indicators and talks about how those can be normalized to the output or performance of your factory, system or process. This is a key step.
These are shown below categorized by Inputs, Operations and Products, from the Toolkit.
This is a good set of indicators and the toolkit indicates that indicators such as water intensity, energy intensity and green house gas intensity can be extended to measure supply chain related impacts.
An important "next step" is the selection of normalization factors - that is, relating the level of performance to the individual product (piece, weight, volume) or to sales volume, person-hours worked, etc.
We'll go on to that in the next posting and explain more of the OECD Toolkit procedure and application in the next part of this discussion.
Thursday, October 13, 2011
Consuming all but the oink!
Or, using most of what you have
When I was a graduate student in Madison in the early 70's I had a part time job working with a small company that delivered rock salt for domestic water softeners, sales in markets and stores and, on some occasions, to some major food processors in the area. One of those we'd deliver to was the Oscar Mayer Company.
There used to be a saying that Oscar Mayer used every part of the pig but the "oink" in making products (at least the pork based ones!). We also delivered to Frito-Lay but, other than getting some bags of chips that happened to "fall into our truck," we learned little about making potato chips.
I cannot confirm the exact details of material utilization at Oscar Mayer from my contact with them when a student, but it always struck with me as an ideal "buy to fly" ratio for food processing. I did observe truckloads of animal carcasses at the loading dock heading off to make gelatin and other products. Can't use much more of your raw materials than that.
On this subject, I was contacted a while back by some folks working in the furniture business on the East coast about maximizing yield in lumber processing for furniture. That sounded interesting to me.
One company, Manchester Wood, sent me some info about how they maximize yield on raw lumber in their production process. They also sent a link to a video that depicts their use and processing of raw materials.
According to my contacts there, they use the latest technology for ripping and cutting raw lumber in their rough mill. Six cameras view the boards to determine where the boards should be cut to insure they get the most yield from each log being sawn. Ripped boards get marked with a crayon to note defects. A computerized cut off saw reads markings and calculates the best cut for the highest yield. The edging pieces go through the hog to grind up material for shavings which goes to local farms for livestock bedding. A hog is sort of a hammer mill with a rotor with fixed hammers and tips for shredding wood waste, bark, scraps, etc. It makes bigger things small.
They also edge glue wood parts into panels to get a better yield by utilizing otherwise parts too small for commercial use. They try to use as much of our raw materials as we can while minimizing any waste.
Materials that they can't use, they try to recycle locally.
Another company making wood furniture products that I've had some communication with is Harden Furniture. You can see a video presentation of their factory operations (actually the video starts in the forest and follows the processing/building of furniture through shipping). They use very little natural gas and almost no other fossil fuels as most of their facility is heated with wood waste.
They have a strong commitment to sustainable production and describe their activities on the web. This website gives a lot of background on the energy used and impacts in furniture manufacturing as well as a comparison of the net carbon emissions in producing a ton of wood versus other materials (from brick to aluminum). Wood looks pretty good!
There is another example I just was referred to - check out this youtube video of very clever utilization/recycling of materials. My dad (recall the "it'll come in handy if I never use it" comment from a past blog?) would have loved this one!
Finally (and on a different subject) the Organization for Economic Co-operation and Development (OECD) has just launched the OECD Sustainable Manufacturing Toolkit. You can find some background on this organization on their website.
The toolkit is, according to the OECD website, "designed to help businesses around the world, particularly supply chain firms and small and medium-sized enterprises (SMEs), develop a more viable, socially responsible business approach and make the most of green growth opportunities. It provides a set of 18 internationally applicable, common and comparable key performance indicators to measure and improve the environmental performance of manufacturing facilities. This indicator framework owes to much to the existing variety of environmental and CSR initiatives and offers a potential for future standardization in this area."
The toolkit is specially designed for businesses looking to address sustainability in terms of what it means, how it relates to their business, and how they might benefit from greener production. A bit like this blog!
The Toolkit includes a Start-up Guide, which provides a step-by-step approach to measuring and benchmarking environmental performance, and a Web Portal which provides additional technical guidance, data tools and useful links.
You can download the start-up guide and start reading!
We'll discuss some of the features, applicability and other related elements/issues with the toolkit next time.
Sunday, September 25, 2011
Less is more, part 7
Maximum flexibility with minimum impact
This will be the last in the less is more series and is "tech heavy" again.
In the last posting we described the concept of an error budget as used in design of precision machines and then proposed to apply a parallel concept as a "sustainability budget" for including the environmental/resource impacts in the design process. We hoped with this to design a machine that met both the requirements for machine performance as well as a more sustainable (or at least greener) machine.
We ended with a description of the construction of a sustainability budget following the three basic steps:
Step 1: determine an energy, material and resources (consumables, etc.) model of the machine and its principal components in the form of a series of relationships defining the energy consumption, materials use as a function of machine design or operation. (This might be referred to as energy or materials mapping.)
Step 2: analyze systematically each type of energy and material use in the system and determine the relative performance-energy/material impact (for example, from Ashby charts).
Step 3: combine the energy/materials impacts to yield upper and lower bound estimates of the total energy/material impact of the machine.
We noted that it was important that the embedded energy and materials must be counted.
So, now an example of constructing a sustainability budget.
The critical part of building these budgets (error or sustainability) is accumulating the data needed to populate the budget. Material data sources are very helpful in determining the basic material-performance characteristics (like modulus of elasticity, thermal properties, density) that are of use in machine design as we have seen. But, these need to be “connected” to embedded energy and operating energy consumption for use in a sustainability budget. Although there are many materials texts available, one excellent source of such “connections” is the text book “Materials: Engineering, Science, Processing and Design” by Ashby, Shercliff and Cebon, Elsevier, 2010.
Ashby uses an approach (or strategy) for materials selection which is comprised of four steps:
- translation of design requirements in terms of function, objectives, etc.
- screening to select most usable materials meeting the requirements
- ranking with respect to some set of criteria, and
- documentation on background and history of the material in this or related uses
This strategy attempts to get the best match between the characteristics of materials (or processes if the four steps are used for process selection) and those required by the design (functionality and constraints). We would add, as one of the screening elements, the need to assess environmental compatibility, energy use and embedded energy, global warming gas emission impacts, etc. Embedded energy is that energy that has gone into the mining, conversion, processing, and transportation of the material up to the point it enters our control or manufacturing facility for use in our product.
This would work as follows. The machine designer first determines the specifications required for the precision device as usual as inputs to the left side of figure below (from Dornfeld Precision Engineering, Springer, 2010). A parallel discussion could be had for a process design or system of devices of processes but to simplify the discussion we stay with one device here - a precision machine.
Figure Design to sustainability selection chart, thermal stability example
The designer determines that a critical requirement is that the device should be insensitive to variations in temperature where it operates and, since the device is heavily constrained (meaning the device cannot change size due to temperature variations without experiencing bending - picture a simple beam that is being heated and it is held at each end in a vise. When it heats up it will expand along the length and, if heated enough, eventually bend up or down) the variable set of interest includes the modulus of elasticity, E, the coefficient of thermal expansion, α, and the conduction coefficient, k. This defines how much the material can be deformed with out permanent "plastic" deformation or damage (that is, spring constant), how much the material expands per degree of temperature rise and how readily the material conducts heat.
For this situation, it is known that the combination of Eα/k (or elasticity times thermal expansion divided by the conductivity) should be as low as possible to minimize thermal distortion and that will define a set of suitable materials. We can find a wide range of materials with differing expansion and conduction coefficients. Depending on which of these materials we choose, we can determine the energy or sustainability impact by noting the embedded energy (for example) as a function of the weight or volume of the material (or materials) chosen and the amount needed for the design. For example, the figure below, from Ashby shows the relationship between embedded energy for a range of materials and the embodied energy/m3, or production energy per unit volume. We see that more “exotic” materials, often
Figure Production energy per volume for a range of materials, from Ashby
used for thermal stability have higher embedded energy due to production requirements. This gets us through Step 2 of the sustainability budget creation.
However, it must be noted that there are usually other issues that need to be considered besides embedded energy (such as societal impacts if the material is toxic or hazardous or comes from a region where damage is done in mining or extraction) for a complete assessment of sustainability. Also, it is clear that we could create a set of charts as in the design figure shown first above for other constraints in machine design (chatter or vibration for example, in a milling machine, where the key parameter might include stiffness of the component and the tradeoff could be between cross-sectional area/geometry and stiffness; alternate material choices could be conventional carbon steel, a composite material with high stiffness to weight ratio, or a ceramic (which would also have beneficial thermal properties).
Step 3 of the sustainability budget construction requires combining the energy/materials impacts to yield upper and lower bound estimates of the total energy/material impact of the machine. Summing these for a series of machines in a system would give us a system budget. The most challenging part of this step is determining the “sensitivity” of sustainability to device specifications.
We need to make the same type of analysis relative to the sensitive directions that we are designing our device to protect for error sources and the materials in their configurations we are using to accomplish that. Ideally, following our procedure in the design figure above, we could determine a range of material properties that can be varied to affect the design requirement of concern, for example thermal stability in the above example, but which would have no or minimal effect on embedded energy. This would be a sort of sensitivity analysis to energy or environmental impact similar to that seen in machine stiffness evaluation.
That is, a design/material which allows us to meet design requirements with the maximum of flexibility while having minimal impact on environmental damage would allow the application of the conventional error budget without much additional constraint. It would, in effect, decouple the design and material choice from the sustainability impact for a defined range of conditions.
Let’s look at an example. In the Ashby figure above we can see that, at an embodied energy of about 105 Mj/m3 a wide range of materials exist spanning cast irons and some carbon steels to metal foams. Depending on the density of metal foams their modulus of elasticity can be as far from or as close to their parent material. This is not the case for carbon steels and cast irons. Similarly, thermal properties will vary tremendously between metal foams and cast iron, as will damping characteristics (important in machine tool structures). But, from an embodied energy perspective they are all quite similar. So there is an insensitivity we can take advantage of.
Tradeoffs in energy/materials sustainability (depending on what part of the life cycle it is used in) also need to be considered. Some “static” structures such as heavy machine tool bases which support but do not move with the machine axes can be made of heavier materials as their impact on energy of the machine during the “use” phase will not be large. Components making up the moving portions of the machine will logically expend more energy during their life with than stationary components as with each motion, energy will be expended in moving the component proportional to mass (among other things.)
This was a rather straightforward example discussed above. More detailed examples are suitable for a graduate course discussion but one can get the idea.
The key "takeaway" here is the concept of a selecting a design/material which allows us to meet the design requirements with the maximum of flexibility while having minimal impact on environmental damage. Maximum flexibility with minimum impact! This would, in effect, decouple the design and material choice from the sustainability impact for a defined range of conditions.
Next time we are going to dig into leveraging a bit further with some examples.
Finally, a couple of "plugs" for conferences you may be interested in. We are hosting, at Berkeley, the 19th CIRP Conference on Life Cycle Engineering - "Leveraging technology for a sustainable world" - website is http://lce2012.berkeley.edu/home.html. There is also a "regional meeting" in achieving low CO2 industrial plants - California France Forum on Energy Efficient Technologies - website is http://caffeet.org/. Look forward to meeting some of you at one or both of these!
Friday, September 16, 2011
Less is more, part 6
Budgeting for sustainability
This will be the second to last in the series and, probably, these will be the most complicated since we are talking about some subtle aspects in the design of machines. But, interesting never-the-less!
In the last posting we looked at Ashby's approach to linking material properties to environmental impacts/resource requirements. This time we'll like to apply this to the an example - the design of a precision machine tool. The material here is adapted from Chapter 12 of my book Precision Manufacturing (Springer, 2010; it's on Amazon if you are interested!). We'll set up the discussion in this posting and complete the story in the next, and final, one.
First, we need a formalism for addressing sustainable design of precision machines. This follows from the formalism used for basic machine design. This is referred to as the "sustainability budget." Let me explain.
In the design of machines, specially precision ones (that is, machines that can operate reliably and repeatably positioning workpieces or tooling to great accuracy and with very high resolution - for example, repeatably positioning something within a couple of microns (or nanometers).) This is often accomplished using a technique called "error mapping" and developing an "error budget." These are methods for accounting for the magnitude and eventual impact of the numerous potential sources of error in a machine’s performance – relative to dimensional accuracy, form error, or surface finish.
One does this by determining the likelihood of errors due, for example, to thermal distortion (remember, things expand when heated and contract when cooled so if a machine component is subjected to either of these due to operation or environment) the component will change shape and that will affect the accuracy of the machine. Seems small but, over long machine components, it adds up. Or, for high accuracy, small temperature changes can have a big effect. Steel, for example, has a coefficient of thermal expansion of 11.7 microns/meter/degree C. So, a steel component 10 cm (or about 4 inches; one tenth of a meter) long that experiences a temperature rise of 5 degrees C during operation will "grow" almost 6 microns due to the thermal expansion. That's a lot in the precision manufacturing community! Larger structures can grow more. And, 5 degrees C is easy to experience in most conventional manufacturing facilities.
We can put the machine in a conditioned environment where the temperature is maintained constant but that cost money and, importantly, uses a lot of energy. Or we can put circulating oil systems on machines with temperature controlled oil to maintain a constant temperature but that adds to the machine's energy footprint also. And, since the circulating system usually runs even when the machine is not producing work, this makes the idle state of the machine almost as bad as the production state.
There are materials with almost zero coefficients of thermal expansion - but they are costly in terms of money and energy to create. So, we'd like to design the machine to have as little sensitivity to thermal distortion while using materials that have lower environmental impact.
One of the concepts in precision machine design relates to identifying, first, the “sensitive direction” in the machine. This is the direction in which an error impacts the part quality: dimension, form, roughness. For example, if you are trying to create a surface with a certain dimension by machining, then you want to control the position of the cutting tool relative to that surface with great accuracy. Any error in the position of the tool relative to the surface will result in an error. So, for this operation, the axis of tool motion towards and away from the surface during machining would be the sensitive direction.
The way we can keep track of all the contributions to the errors in the machine can be referrer to as an "error budget." This budget allowed us to include all sources of error and an estimate of their relative magnitudes and then determine which of these sources actually impacted a sensitive direction resulting in a part error. The term budget is chosen exactly to represent what, like a budget for household expenditures, is available to be distributed over all the requirements for operation. Just as in a household budget where some of the monthly funds must cover groceries, insurance, transportation, etc., in an error budget, we allocate the elements making up the total error in such a way that, when we are done with designing the machine, the cumulative error, in the sensitive direction, do not exceed our requirements.
So, errors in the machine due to thermal effects, loads due to moving workpieces or forces generated in machining (which cause another type of distortion, elastic distortion, due to the elasticity of the material the component is made of), gravity loads, or vibrational excitation due to rotating spindles or tooling, are estimated. From these estimates it is determined by modeling the machine structure kinematically, in what way these errors affect the machine tool operation and accuracy and, then, to what extent they affect the sensitive direction.
Now, an important concept in this method is that an error that exists but does not affect the sensitive direction is not of concern. Meaning, something could be going on in the machine but as long as it does not affect the location of the tool relative to the workpiece in the example we've been discussing, we don't need to worry about it.
This would be like going to a restaurant which serves a fixed price buffet. You could eat a lot, or a little, and, from the point of view of your budget, it wouldn't matter. With graduate students, that means you can eat a lot!
So, in the case of an error source not impacting the sensitive direction, we have a lot more design freedom with no apparent penalty in terms of performance.
So by now you are asking what the heck this has to do with the subject of the blog!
Consider if we would add constraints on the environmental performance of a machine while insisting that the other quality metrics are met as well as the manufacturing performance (throughput, lead time, cost/piece to operate, etc.) This could be included in our budget analysis but, in this case, we’d call it a "sustainability budget". A sustainability budget would operate similarly to an error budget except we would be looking for the impact, from environmental metric point of view, of the design and operation of the precision machine, process or system.
Then, using the idea of sensitive directions (and the complementary concept of non-sensitive directions – that is, those directions for which any error from a specific source has no effect) we can imagine an analysis which measures the impact of materials, designs, or operating conditions on the overall environmental behavior. Then we look for instances of materials, design features or operating conditions that give the largest range of variability, from the point of view of design, with the least environmental impact. That is, those instances for which little or no sensitivity is displayed.
Following a methodology based on this would allow us to design the machine, or system of machines, in such a way that the basic performance, precision and accuracy, would meet the core error budget constraints but, in addition, we could do so in a way that was more sustainable.
Great idea but how do we do this?! Let's get started.
In the design of a precision machine the first requirement is to derive an error budget. Now it gets a bit complicated. Creating an error budget relies on two sets of rules — connectivity and combinational. Connectivity rules define the behavior of machine components and interfaces in the presence of errors. That is, how does the error in one component affect the position (for example) of another component. This is sort of like trying to level a table in a restaurant by sticking little bags of sugar under one of the legs. Sometimes you are lucky and it works the first time. Other times changing one leg makes another lose contact with the floor and the table still wobbles. That's is a simple example but that is connectivity.
Then, the combinational rules define how the errors are to be combined to determine the impact on the accuracy of the workpiece. That means, how all these connected components, experiencing the various sources of error, combine to affect the sensitive direction. Not surprisingly, this is done with mathematics.
The procedure is comprised of the following three steps:
Step 1 — make the model of connectivity. This is called the error map. We do this by determining a kinematic model of the machine and its principal components in the form of a series of matrices,
Step 2 — analyze systematically each type of error in the system and use the mold to determine the relative tool-work errors. This is determining a relationship defining how the errors affect the sensitive direction, and finally
Step 3 — combine the errors to yield maximum and minimum estimates of the total error of the machine. Sort of like specifying tolerances on a part length - the error of importance will likely be within this range.
If we revise this approach for a sustainability budget, we’d follow the same three basic steps but with some different objectives. For example, we would add some elements to the three steps, or, actually, develop a parallel set of “models” and analysis.
Parallel to Step 1 would be:
- determine an energy, material and resources (consumables, etc.) model of the machine and its principal components in the form of a series of relationships defining the energy consumption, materials use as a function of machine design or operation. (This might be referred to as energy or materials mapping.)
Parallel to Step 2 would be:
- analyze systematically each type of energy and material use in the system and determine the relative performance-energy/material impact (for example, from Ashby charts).
Parallel to Step 3 would be:
- combine the energy/materials impacts to yield upper and lower bound estimates of the total energy/material impact of the machine.
Importantly, in this parallel analysis, the embedded energy and materials must be counted. That is, we cannot only look at the energy to move an axis of the machine (for example in a precision machine tool) but we’d need to consider also the energy associated with the earlier material processing and conversion, any subcomponents or subsystems, etc. Also, some measure of global warming gas generation and any other environmental impact effects must be included.
We are, essentially, estimating the footprint of this device we are designing. This makes the analysis rather complex and, unfortunately, not as analytical as the construction of the conventional error budget first described.
But, it makes sense. And, next time, we'll add details and apply this to an example.
Subscribe to:
Posts (Atom)